How ten condo launches sold, and at what price
Launch-weekend results and average price per sq ft for the ten launches covered on this site, so you can see where the market has been moving.
- In this set, average launch prices run from $2,180 psf (Narra Residences) to $3,140 psf (Dunearn House), a gap of $960 psf.
- Take-up depends on more than price. A lower price per sq ft did not always mean faster sales, and the biggest project here sold 90.1% of its homes.
- A launch count is a snapshot. Homes keep selling after the weekend, so ask which types and floors are still open.
The market around these launches
URA’s figures for the third quarter of 2026 show private home prices still rising, and fewer launches than the quarter before.
Lucerne Grand and Thomson Reserve launched in October, so they fall in the fourth quarter and are not in these numbers yet.
The ten launches, side by side
Filter by region, then sort. Tap a launch to open its full guide with floor plans.
Simple average of the launch averages shown, not weighted by size. Together these launches had 5,786 homes, with 3,357 sold at the counts reported.
Figures are as reported in the news coverage of each launch. The count was taken at different points (launch day, launch weekend or a set hour), so compare the bars as a guide, not a ranking. Prices are launch averages per sq ft. Region is the URA market segment.
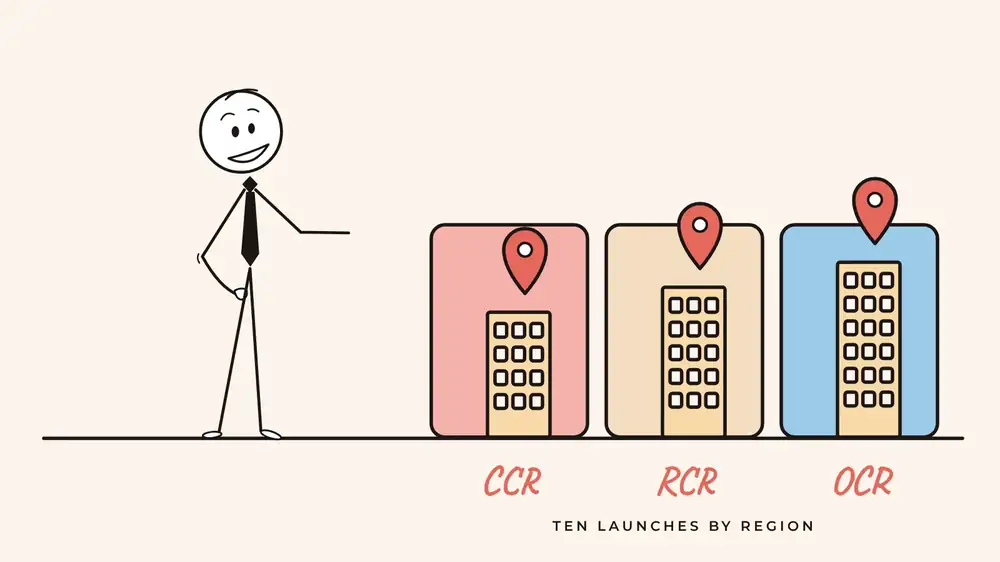
The ten launches by region
URA groups private homes into three market segments, and each behaves differently. The central areas are the most expensive per sq ft. The suburbs cost less and have the larger projects.
| Region | Area | Launches | Homes | Sold at count | Share sold | Average psf |
|---|---|---|---|---|---|---|
| CCR | Core Central Region | 3 | 1,529 | 588 | 38.5% | $3,037 |
| RCR | Rest of Central Region | 3 | 1,380 | 871 | 63.1% | $2,622 |
| OCR | Outside Central Region | 4 | 2,877 | 1,898 | 66.0% | $2,478 |
In this set, the 4 OCR launches averaged $2,478 psf and the 3 CCR launches $3,037 psf. Share sold is the counts as reported divided by total homes, so it mixes early and later counts. Read it as a guide only.
How to read a launch result
A tracker gives you four numbers. Each says something different, and none says everything.
Shows how much of the project found buyers at the count reported. The count is taken at different points, from launch day to a set time after.
A comparison tool across projects. It hides the spread inside one project, where small units cost more per sq ft than large ones.
A 1,268-home project selling 1,143 homes is a larger market event than a 212-home project selling 23. Compare shares with the totals in view.
Rules, prices and interest in new launches change. A result from early 2026 sat in a different market from one in October.
Three things in the numbers
Thomson Reserve sold 1,143 of 1,268 homes (90.1%) at an average of $2,900 psf, the highest take-up of the ten and the largest project. Most 3-bedroom and larger homes went at launch.
Zyon Grand sold 84% at $3,050 psf, while Narra Residences sold 24.8% at $2,180 psf. Location, size of the project and timing all differ, so a lower price per sq ft does not guarantee faster sales.
Homes keep selling after the weekend, so the share sold at launch is not the share sold today. Ask which types and floors are still open before you plan around one.
The same home at each launch’s average price
This table multiplies each launch’s average price per sq ft by three sizes. Roughly, 700 sq ft is a 2-bedroom, 1,000 sq ft a 3-bedroom and 1,300 sq ft a 4-bedroom. Lowest price first.
| Launch | Region | Avg psf | 700 sq ft | 1,000 sq ft | 1,300 sq ft |
|---|---|---|---|---|---|
| Narra Residences | OCR | $2,180 | $1,526,000 | $2,180,000 | $2,834,000 |
| Lentor Gardens Residences | OCR | $2,350 | $1,645,000 | $2,350,000 | $3,055,000 |
| The Sen | RCR | $2,358 | $1,650,600 | $2,358,000 | $3,065,400 |
| Hudson Place Residences | RCR | $2,458 | $1,720,600 | $2,458,000 | $3,195,400 |
| Lucerne Grand | OCR | $2,480 | $1,736,000 | $2,480,000 | $3,224,000 |
| Thomson Reserve | OCR | $2,900 | $2,030,000 | $2,900,000 | $3,770,000 |
| One Marina Gardens | CCR | $2,953 | $2,067,100 | $2,953,000 | $3,838,900 |
| Amberwood at Holland | CCR | $3,019 | $2,113,300 | $3,019,000 | $3,924,700 |
| Zyon Grand | RCR | $3,050 | $2,135,000 | $3,050,000 | $3,965,000 |
| Dunearn House | CCR | $3,140 | $2,198,000 | $3,140,000 | $4,082,000 |
An average per sq ft is not the price of a particular unit. Real prices vary with floor, facing, stack and type, and smaller homes usually cost more per sq ft. Use the table to size the range, then check the launch guide.
What this means if you are selling an HDB flat
A quick way to read price per sq ft: multiply by the size you want. For a 1,000 sq ft home, the lowest launch average here ($2,180 psf at Narra Residences) works out to about $2.18 million, and the highest ($3,140 psf at Dunearn House) to about $3.14 million.
Before a visit, the showflat checklist and the guide to reading a floor plan and site plan help you ask the right questions. To compare a launch with a resale condo or an EC, see new launch, resale or EC.
Your HDB sale does not have to cover all of that. It is the first of the numbers to check, and the worksheet shows how the sale, the loan and your CPF fit together. For the worked version with real stamp duty figures, read the next post in this series.
What the tracker cannot tell you, so ask at the showflat
The numbers above are public. These answers are not, and they are worth asking about at any launch you visit.
The showflat checklist has the full list to take with you.
Sources
Where these figures come from
URA: Release of 3rd Quarter 2026 real estate statistics (23 October 2026), for the price index, developer sales and launches.
Launch results, units and average prices come from news reports on each launch. Each launch guide links its source: Thomson Reserve, Lucerne Grand, Amberwood at Holland, Dunearn House, Lentor Gardens Residences, Hudson Place Residences, Narra Residences, The Sen, Zyon Grand, One Marina Gardens.
Keep reading
More to read next
Next step
See what fits your sale
Pick a launch that interests you, then put your own sale price into the worksheet to see the cash and CPF side.
A real estate professional helping Singapore HDB owners work out their numbers before they upgrade to a condo or EC.
WhatsApp me